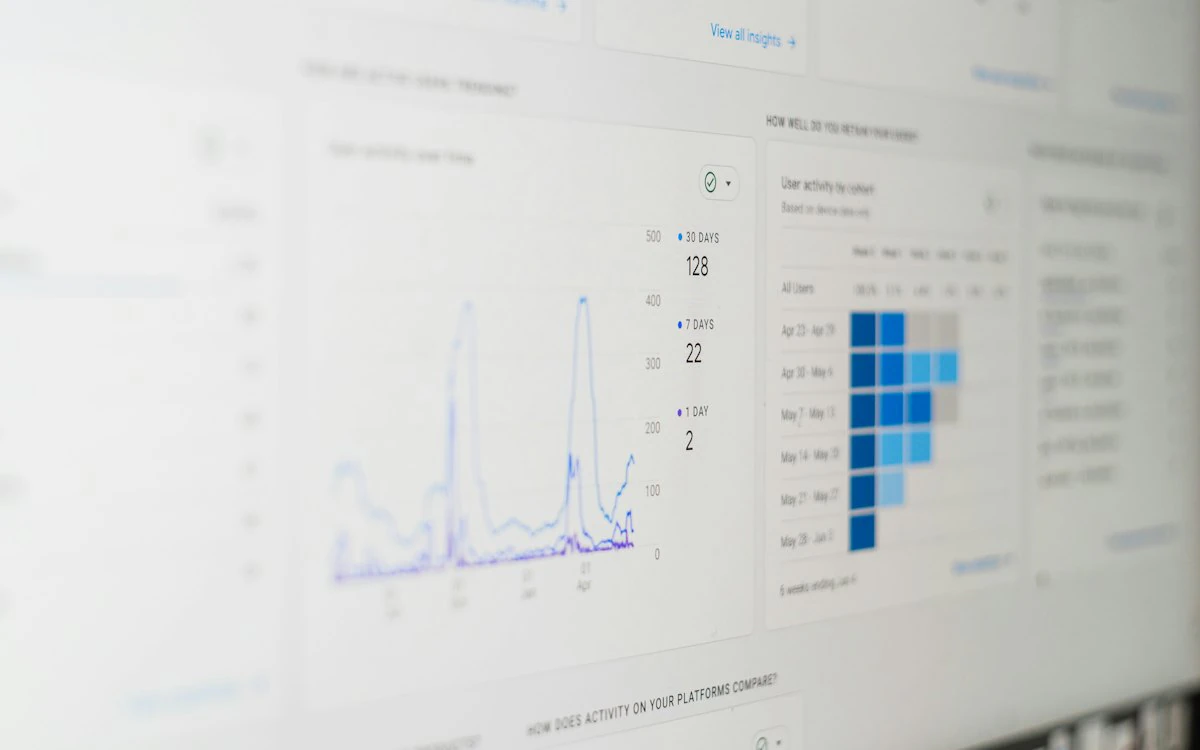
Marketing teams rarely use just one platform.
A typical marketing stack might include:
- Google Ads for paid search
- Meta Ads for paid social
- LinkedIn Ads for B2B campaigns
- GA4 for website analytics
- Google Search Console for SEO
- Email platforms for lifecycle campaigns
- A CRM for leads and pipeline
- Spreadsheets for reporting
Each platform does its own job well.
The problem starts when leadership asks a simple question:
"How is marketing performing overall?"
Now someone has to collect data from multiple systems, reconcile different metrics, build a report, and try to explain what everything means.
This is the problem a unified marketing dashboard is designed to solve.
A unified marketing dashboard brings marketing data from multiple channels into one connected view so teams can monitor performance, compare channels, understand trends, and connect marketing activity with business outcomes.
But simply putting several data sources onto one screen isn't enough.
A genuinely useful dashboard needs to solve the deeper problems of data consistency, attribution, metric definitions, and decision-making.
What Is a Unified Marketing Dashboard?
A unified marketing dashboard is a reporting and intelligence environment that brings data from multiple marketing platforms into a single view.
Instead of switching between:
- Google Ads
- Meta Ads
- GA4
- Search Console
- CRM
marketers can access the relevant performance information from one place.
A unified dashboard might show:
Google Ads
- Spend
- ₹3,00,000
- Leads
- 420
- CPA
- ₹714
- Pipeline
- ₹18L
Meta Ads
- Spend
- ₹2,00,000
- Leads
- 510
- CPA
- ₹392
- Pipeline
- ₹11L
LinkedIn Ads
- Spend
- ₹1,50,000
- Leads
- 120
- CPA
- ₹1,250
- Pipeline
- ₹9L
Organic
- Spend
- —
- Leads
- 340
- CPA
- —
- Pipeline
- ₹14L
| Channel | Spend | Leads | CPA | Pipeline |
|---|---|---|---|---|
| Google Ads | ₹3,00,000 | 420 | ₹714 | ₹18L |
| Meta Ads | ₹2,00,000 | 510 | ₹392 | ₹11L |
| LinkedIn Ads | ₹1,50,000 | 120 | ₹1,250 | ₹9L |
| Organic | — | 340 | — | ₹14L |
The advantage isn't simply convenience.
The real advantage is being able to compare these channels using a common performance framework.
Why Marketing Data Becomes Fragmented
Every platform was designed for a different purpose.
Google Ads is designed around advertising performance.
Meta is designed around social advertising.
GA4 focuses on website and user behavior.
Search Console focuses on search performance.
A CRM focuses on customer and sales relationships.
These systems naturally use different:
- Definitions
- Attribution models
- Time zones
- Conversion windows
- Naming conventions
- Data structures
As a result, marketing teams can end up with multiple versions of the truth.
The Problem With Checking Each Platform Separately
Suppose the CMO asks:
"Which channel performed best last month?"
The answer changes depending on where you look.
Google Ads might say:
Campaign A generated 200 conversions.
Meta might say:
Campaign B generated 300 conversions.
GA4 might report a different number.
The CRM might show:
Only 85 of those leads became qualified opportunities.
Now the team has a reporting problem.
It's not necessarily that any platform is wrong.
They're measuring different parts of the customer journey.
A unified marketing dashboard provides a place to bring those perspectives together.
The Four Main Ways Teams Try to Unify Marketing Data
There are four common approaches.
Option 1: Spreadsheets
This is where many teams start.
Export data from each platform.
Paste it into a spreadsheet.
Add formulas.
Build charts.
Repeat every week or month.
It works.
Until it doesn't.
The Hidden Cost of Spreadsheet Reporting
Imagine a marketer spends 8 hours every month creating a performance report.
That's:
8 hours × 12 months = 96 hours per year
And that's just one report.
There are also risks:
- Manual errors
- Outdated data
- Broken formulas
- Copy-paste mistakes
- Different reporting definitions
- Version-control problems
- Delayed insights
The biggest problem isn't even the time.
It's that the report is usually already becoming outdated when it is delivered.
Option 2: Native Platform Dashboards
Every marketing platform already has a dashboard.
So why not simply use them?
Because native dashboards generally answer questions about their own platform.
Google Ads can tell you about Google Ads.
Meta can tell you about Meta.
LinkedIn can tell you about LinkedIn.
But the CMO doesn't necessarily want three separate answers.
They want:
"How is paid marketing performing overall?"
And ideally:
"How is marketing contributing to pipeline and revenue?"
That requires information from multiple systems.
Option 3: BI Tools and Data Warehouses
For larger organizations, another approach is to build a data warehouse and connect it to a business intelligence platform.
This can be extremely powerful.
A typical architecture might look like:
Google Ads
↓
Meta Ads
↓
LinkedIn Ads
↓
GA4
↓
CRM
↓
Data warehouse
↓
BI platform
This gives organizations significant flexibility.
But it can also require:
- Data engineering
- ETL pipelines
- Maintenance
- Data modeling
- Infrastructure
- BI development
- Technical expertise
For organizations with complex data requirements, this may be appropriate.
For a marketing team that simply wants reliable cross-channel performance visibility, it can be more infrastructure than necessary.
Option 4: A Marketing Intelligence Layer
The fourth approach is a dedicated marketing intelligence platform.
Instead of building the entire infrastructure yourself, the platform connects to marketing sources and creates a marketing-specific unified view.
The architecture becomes:
Marketing platforms
↓
Marketing intelligence layer
↓
Unified performance
↓
Insights
↓
Actions
This is the approach QuikInsight is designed around.
What Data Should a Unified Marketing Dashboard Include?
There is no universal list.
But a useful dashboard often includes five categories.
1. Paid Marketing
Connect:
- Google Ads
- Meta Ads
- LinkedIn Ads
- YouTube Ads
Track:
- Spend
- Impressions
- Clicks
- Conversions
- CPA
- ROAS
- Campaign performance
2. Organic Marketing
Connect:
- GA4
- Google Search Console
- Social platforms
Track:
- Organic traffic
- Search visibility
- Rankings
- Engagement
- Organic conversions
3. Email and Outbound
Connect relevant platforms such as:
- Mailchimp
- Brevo
- Instantly
- Other outbound systems
Track:
- Opens
- Clicks
- Replies
- Conversion
- Campaign performance
4. Leads and Pipeline
Connect the CRM.
This is critical.
Without CRM data, many marketing dashboards stop at lead generation.
With CRM data, you can move toward:
Campaign → Lead → Qualified Lead → Opportunity → Pipeline → Revenue
That's a much stronger performance story.
5. Business Outcomes
Where possible, connect marketing performance to:
- Revenue
- Pipeline
- Qualified leads
- Customer acquisition
- Conversion
- CAC
- ROI
This is what transforms a marketing dashboard from an activity report into a business-performance tool.
The Metric Mismatch Problem
One of the biggest challenges in cross-channel reporting is that platforms don't always define metrics the same way.
Consider conversions.
Google Ads might report:
200 conversions
Meta might report:
250 conversions
But this doesn't necessarily mean the company acquired 450 customers.
The same user may appear in multiple systems.
This is why simply adding platform numbers together can produce misleading results.
Attribution Windows Matter
Different advertising platforms can use different attribution windows.
For example, one platform may credit a conversion based on an interaction that occurred several days earlier.
Another platform may use a different window.
This can create overlapping claims.
A unified reporting system therefore needs a clearly defined attribution methodology.
The objective isn't to make every platform agree.
The objective is to create a consistent framework for interpreting them.
Naming Conventions Matter Too
Imagine your campaigns are named:
- Google: SaaS_Search_US_Q3
- Meta: US_SaaS_LeadGen
- LinkedIn: SaaS-Demo-Enterprise
A human can understand these.
A reporting system has a harder time grouping them consistently.
Standardized naming conventions can help.
For example:
Channel → Market → Audience → Objective → Campaign
A consistent structure makes cross-channel reporting easier.
Currency and Time Zone Problems
These issues are easy to overlook.
Imagine:
Google Ads reports in USD.
Meta reports in INR.
LinkedIn reports in EUR.
Your CRM records timestamps in UTC.
Your marketing team operates in IST.
Without normalization, comparisons can become inaccurate.
A unified dashboard should account for:
- Currency
- Time zones
- Reporting periods
- Date formats
before comparing metrics.
What Does "One Source of Truth" Actually Mean?
Many companies say they want one source of truth.
But what does that mean?
It doesn't necessarily mean there must be one database containing every piece of information.
For marketing, it can mean:
Everyone uses the same definitions, data sources, reporting logic, and performance framework when discussing marketing results.
For example, leadership shouldn't receive one pipeline number from marketing and another from sales simply because the teams use different definitions.
A unified system should help establish consistent measurement.
What Should a Unified Marketing Dashboard Show?
A useful executive dashboard should answer important questions quickly.
For example:
Overall Performance
Marketing Health Score: 78
Business Outcomes
- Revenue: ₹1.31 Cr
- Pipeline generated: ₹4.82 Cr
- Qualified leads: 430
Paid Marketing
- Spend: ₹15.6L
- ROAS: 3.1x
- CPA: ₹1,850
Organic
- Traffic: +18%
- Organic leads: +14%
- Open rate: 31.2%
- Click rate: 4.8%
But numbers alone aren't enough.
The dashboard should also surface:
AI flagged 2 campaigns for review
and:
Organic pipeline increased 22%
Now leadership knows where to focus.
A Unified Dashboard Should Prioritize Outcomes
One of the biggest mistakes in marketing reporting is measuring activity instead of impact.
For example:
Activity metrics
- 25 campaigns launched
- 40 social posts published
- 12 emails sent
- 100 keywords tracked
These metrics can be useful operationally.
But leadership often cares more about:
- Qualified leads
- Pipeline
- Revenue
- CAC
- ROI
- Growth
A good dashboard should make the connection between activity and business outcomes clear.
From "What Happened?" to "What Should We Do?"
This is where marketing intelligence goes beyond reporting.
Consider a traditional dashboard:
Meta CPA: ₹620
Now consider an intelligent interpretation:
Meta CPA increased 18% over the previous period, primarily due to lower conversion rates in two campaigns. Campaign C remains below the account average and may warrant additional budget.
The second statement is much closer to a decision.
This is the difference between:
Reporting
and
Intelligence.
How to Build a Unified Marketing Dashboard Step by Step
Step 1: Define Your Business Goals
Before connecting platforms, determine what marketing is supposed to achieve.
Examples:
- Pipeline
- Revenue
- Lead generation
- Customer acquisition
- Brand growth
Step 2: Inventory Your Marketing Platforms
Create a list of every important source.
For example:
Paid search
- Platform
- Google Ads
Paid social
- Platform
- Meta Ads
B2B advertising
- Platform
- LinkedIn Ads
Website
- Platform
- GA4
SEO
- Platform
- Search Console
- Platform
- Mailchimp
CRM
- Platform
- QuikCRM
| Area | Platform |
|---|---|
| Paid search | Google Ads |
| Paid social | Meta Ads |
| B2B advertising | LinkedIn Ads |
| Website | GA4 |
| SEO | Search Console |
| Mailchimp | |
| CRM | QuikCRM |
Step 3: Identify Your Core Metrics
Don't bring every available metric into the dashboard.
Start with metrics tied to your objectives.
For example:
- Spend
- Leads
- Qualified leads
- CPA
- Pipeline
- Revenue
- ROAS
Step 4: Standardize Definitions
Document:
- What counts as a lead?
- What counts as qualified?
- What counts as a conversion?
- What attribution model are you using?
- Which reporting period applies?
This step is critical.
Step 5: Normalize the Data
Standardize:
- Currency
- Time zone
- Campaign names
- Channel names
- Dates
- Conversion definitions
Step 6: Connect Your Data Sources
Use native integrations or connectors wherever possible.
The objective is to reduce manual exports.
Step 7: Build the Executive View
Start with:
- 1.Overall marketing health
- 2.Business outcomes
- 3.Channel performance
- 4.Major changes
- 5.Areas requiring attention
Don't start with 50 charts.
Step 8: Add Deeper Analysis
Once the executive view is working, add:
- Campaign analysis
- Channel comparisons
- Trend analysis
- Attribution
- Pipeline analysis
- AI insights
Cross-Channel Reporting Example
Imagine a B2B company has:
Google Ads
₹4L spend 300 leads ₹1,333 CPL
Meta Ads
₹2L spend 400 leads ₹500 CPL
₹3L spend 100 leads ₹3,000 CPL
At first glance, Meta looks like the winner.
But now add CRM data.
- Leads
- 300
- Qualified Leads
- 95
- Pipeline
- ₹32L
Meta
- Leads
- 400
- Qualified Leads
- 40
- Pipeline
- ₹12L
- Leads
- 100
- Qualified Leads
- 55
- Pipeline
- ₹28L
| Channel | Leads | Qualified Leads | Pipeline |
|---|---|---|---|
| 300 | 95 | ₹32L | |
| Meta | 400 | 40 | ₹12L |
| 100 | 55 | ₹28L |
Now the story changes.
Meta generates the most leads.
Google generates the most pipeline.
LinkedIn generates fewer leads but significant pipeline relative to lead volume.
Without CRM-connected reporting, that context can disappear.
The Difference Between a Marketing Dashboard and Marketing Intelligence
Multiple platforms
- Basic Dashboard
- Limited
- Unified Marketing Intelligence
- ✓
Cross-channel reporting
- Basic Dashboard
- Sometimes
- Unified Marketing Intelligence
- ✓
Common metrics
- Basic Dashboard
- Limited
- Unified Marketing Intelligence
- ✓
CRM connection
- Basic Dashboard
- Sometimes
- Unified Marketing Intelligence
- ✓
Trend detection
- Basic Dashboard
- Limited
- Unified Marketing Intelligence
- ✓
AI analysis
- Basic Dashboard
- Usually not
- Unified Marketing Intelligence
- ✓
Proactive insights
- Basic Dashboard
- Rare
- Unified Marketing Intelligence
- ✓
Natural-language questions
- Basic Dashboard
- Rare
- Unified Marketing Intelligence
- ✓
Executive reporting
- Basic Dashboard
- Manual
- Unified Marketing Intelligence
- Automated
Recommended actions
- Basic Dashboard
- Manual
- Unified Marketing Intelligence
- AI-assisted
| Capability | Basic Dashboard | Unified Marketing Intelligence |
|---|---|---|
| Multiple platforms | Limited | ✓ |
| Cross-channel reporting | Sometimes | ✓ |
| Common metrics | Limited | ✓ |
| CRM connection | Sometimes | ✓ |
| Trend detection | Limited | ✓ |
| AI analysis | Usually not | ✓ |
| Proactive insights | Rare | ✓ |
| Natural-language questions | Rare | ✓ |
| Executive reporting | Manual | Automated |
| Recommended actions | Manual | AI-assisted |
A unified dashboard gives teams a shared view.
Marketing intelligence goes one step further by helping interpret that view.
How QuikInsight Unifies Marketing Data
QuikInsight is designed to sit above the existing marketing stack.
Instead of asking teams to replace their existing tools, it connects marketing data from multiple platforms into a unified performance environment.
Supported sources include platforms such as:
- Google Ads
- Meta Ads
- LinkedIn Ads
- YouTube Ads
- Google Analytics
- Google Search Console
- Email platforms
- Social platforms
- Outbound tools
- CRM systems
The goal is to create one connected view of marketing performance.
QuikInsight then adds AI-powered capabilities to help answer:
What is happening?
What is working?
What is not working?
Why is it happening?
What should we do next?
Why QuikInsight Is More Than a Marketing Dashboard
A dashboard tells you what happened.
QuikInsight is designed to help explain what the data means.
Its capabilities include:
Unified Growth Dashboard
Bring paid, organic, email, and lead performance together.
Paid Marketing Intelligence
Compare spend, ROAS, CPA, and pipeline across advertising channels.
Organic Marketing Intelligence
Monitor traffic, rankings, engagement, and organic performance.
Email & Outbound Intelligence
Connect engagement and outbound performance.
Leads & Pipeline
Connect marketing activity with CRM outcomes.
Ask AI
Ask questions about your marketing data in plain English.
Proactive Insights
Surface campaigns losing efficiency, anomalies, and potential opportunities.
Executive Reports
Create reports for executives, boards, teams, or clients.
The objective is not simply to create one more dashboard.
It is to create a connected marketing intelligence layer.
What a Modern Unified Marketing Dashboard Should Look Like
A modern system should follow this hierarchy:
Level 1: Business outcome
Revenue / Pipeline / Qualified leads
↓
Level 2: Marketing health
Overall marketing performance
↓
Level 3: Channel performance
Paid / Organic / Email / Outbound
↓
Level 4: Campaign performance
Which campaigns are driving results?
↓
Level 5: AI insights
What changed? Why? What deserves attention?
↓
Level 6: Action
What should the team do next?
This structure prevents the dashboard from becoming another collection of disconnected charts.
Common Mistakes to Avoid
Mistake 1: Connecting Everything
More data doesn't automatically mean better intelligence.
Only connect sources that contribute to meaningful decisions.
Mistake 2: Tracking Vanity Metrics
Don't let impressions dominate an executive dashboard if pipeline is the real business objective.
Mistake 3: Ignoring CRM Data
Leads aren't always the final outcome.
Connect marketing with pipeline wherever possible.
Mistake 4: Mixing Attribution Models
Make your attribution methodology explicit.
Mistake 5: Building Too Many Charts
A dashboard should prioritize.
Mistake 6: Ignoring Data Definitions
"Lead" should mean the same thing throughout your reporting framework.
Mistake 7: Reporting Without Action
The final question should always be:
What should we do next?
How to Know If Your Marketing Dashboard Is Actually Working
Ask your team these questions:
Can the CMO answer how marketing is performing in under a minute?
If not, the dashboard may be too complicated.
Can marketing and sales agree on pipeline numbers?
If not, your data definitions may need work.
Can you identify an underperforming campaign quickly?
If not, you're probably still reporting rather than monitoring.
Can you compare channels consistently?
If not, normalization may be missing.
Can you explain why performance changed?
If not, you need an intelligence layer.
Can the team identify what to do next?
If not, the dashboard isn't yet decision-oriented.
The Future of Unified Marketing Reporting
Marketing reporting is moving from static dashboards toward intelligent systems.
The progression looks like this:
Separate platforms
↓
Manual spreadsheets
↓
Unified dashboards
↓
Marketing intelligence
↓
AI-powered insights
↓
Prescriptive recommendations
↓
AI-assisted execution
The objective isn't to eliminate marketing platforms.
Google Ads will still be Google Ads.
Meta will still be Meta.
Your CRM will still be your CRM.
The intelligence layer sits above them and helps teams understand how everything fits together.
Frequently Asked Questions
What is a unified marketing dashboard?
A unified marketing dashboard combines data from multiple marketing platforms into one view so teams can monitor, compare, and analyze marketing performance across channels.
How do I combine Google Ads and Meta Ads data?
You can combine Google Ads and Meta Ads data using spreadsheets, BI platforms, data warehouses, or a dedicated marketing intelligence platform that provides native integrations.
Can I connect GA4 and CRM data?
Yes. Connecting GA4 with CRM data can help organizations understand the relationship between website activity, leads, opportunities, and pipeline.
Why should marketing data be unified?
Unifying marketing data reduces platform switching, manual reporting, fragmented metrics, and conflicting performance views. It can also make cross-channel analysis easier.
Is a unified dashboard the same as a marketing intelligence platform?
Not necessarily. A unified dashboard primarily provides visibility across multiple data sources. A marketing intelligence platform typically adds analysis, AI insights, anomaly detection, recommendations, and decision-support capabilities.
What should a marketing dashboard include?
At minimum, consider business outcomes, paid performance, organic performance, lead generation, pipeline, budget utilization, and important trends.
How often should a marketing dashboard update?
That depends on the data source and business requirements. For active campaigns, more frequent updates can help teams identify problems sooner.
Can a unified marketing dashboard replace Google Ads or Meta Ads?
No. It should complement your existing marketing tools by bringing their performance data into a common view.
Final Takeaway
Marketing teams don't need more places to look for data.
They need fewer places to look—and better answers when they do.
A unified marketing dashboard brings Google Ads, Meta Ads, LinkedIn, GA4, email, SEO, and CRM data into a common performance view.
But the real goal goes beyond consolidation.
The best systems help marketers move through the complete cycle:
Connect → Measure → Understand → Decide → Act → Improve
That's the difference between having all your marketing data in one place and actually having marketing intelligence.
QuikInsight is built around that second goal: bringing marketing data together and using AI to help teams understand what is happening, what is working, what isn't, why it is happening, and what they should do next.
See it running on your business.
A walkthrough built around how your team works today.